Search the Community
Showing results for tags 'feature request'.
Found 216 results
-

-
-
-
Now.. i can see if updates need to be installed and give the install command. What about automating this.. or even scheduling this.. even better... When its a vmware environment.. schedule windows update install. But first automatically create snapshots of all systems and then install the windows updates. Afterwards .. sent a notification that the maintenance is done.. we can then check if the updates did not break anything.. and with a simple one click remove all the created snapshots and maintenance would be done.
-
For example this.. http://www.theideawall.com/
-
Now the tool is mostly based on getting some basic notifications.. and is very strong at doing stuf from the mobile.. But i really am missing some piecharts and graphs with historical data of everything that can be monitored like.. CPU trends Memory Trends Disk usage Trends Mail Queue Trends SQL deadlock trends.. just to name a few.. you catch my drift..
-
-
Show in the roadmap what you are working on.. and what is scheduled for the next release.. and what is plant for coming releases. Coming release + next release is enough i guess.. then people know what they can expect.. when.
-
For example we do get notifications on the dashboard about windows updates.. when i remove it.. couple of minute later it comes back again.. We do windows updates once every x-time so i want to be able to postpone an alert for x-period. Also for example a lesser issue.. which will be handled later that day.. in the evening for example (expand disks or something) I want to be able to postpone it for couple of hours.. so that only the really important notifications come through
-
-
-
-
-
-
-
-
-
At this moment we use groups to see logical seperation between our customers that we monitor. But when we select Roles.. for AD, Vmware or whaterver management.. we do not see a logical seperation.. When customers have alot of the same (standard) server names.. we cannot see which server is for which customer.. As you set this product in the market as an MSP product (also) more logical seperation should be possible...
-
-
Now i have to go to a local installed Maager.. do Managed devices (for Example).. and then One by One open devices.. and TYPE in a certain Group.. This is not of this time.. It should be that we only have to install an agent.. connect it to our server.. and then to the management... multiple select / group sorting... policy application etc.. centrally.. with Bulk Actions and all.. Please add this.. the product needs it.
-
You tell us we can monitor everything on any device from anywhere.. But with the vmware addon you cannot even readout the hardware/health status of esx(i) which is very simple because the API is already there.. you just have to read it out.. that all.. Now we do not know if a disk has failed.. and when the second disks fails.. down goes the ESX(i) server...

-

-
 Is it possible to retrieve the current notification via som API/OData/Webservice. And is it posible to to delete a noticifation this way Well, the mobile apps can do it, so I guess teh webservice exists - but is it public available? Altso it would be cool if the notification archive of Enterprise server were availabe as OData so it could be used in PowerBI. Br, Martin.
 -
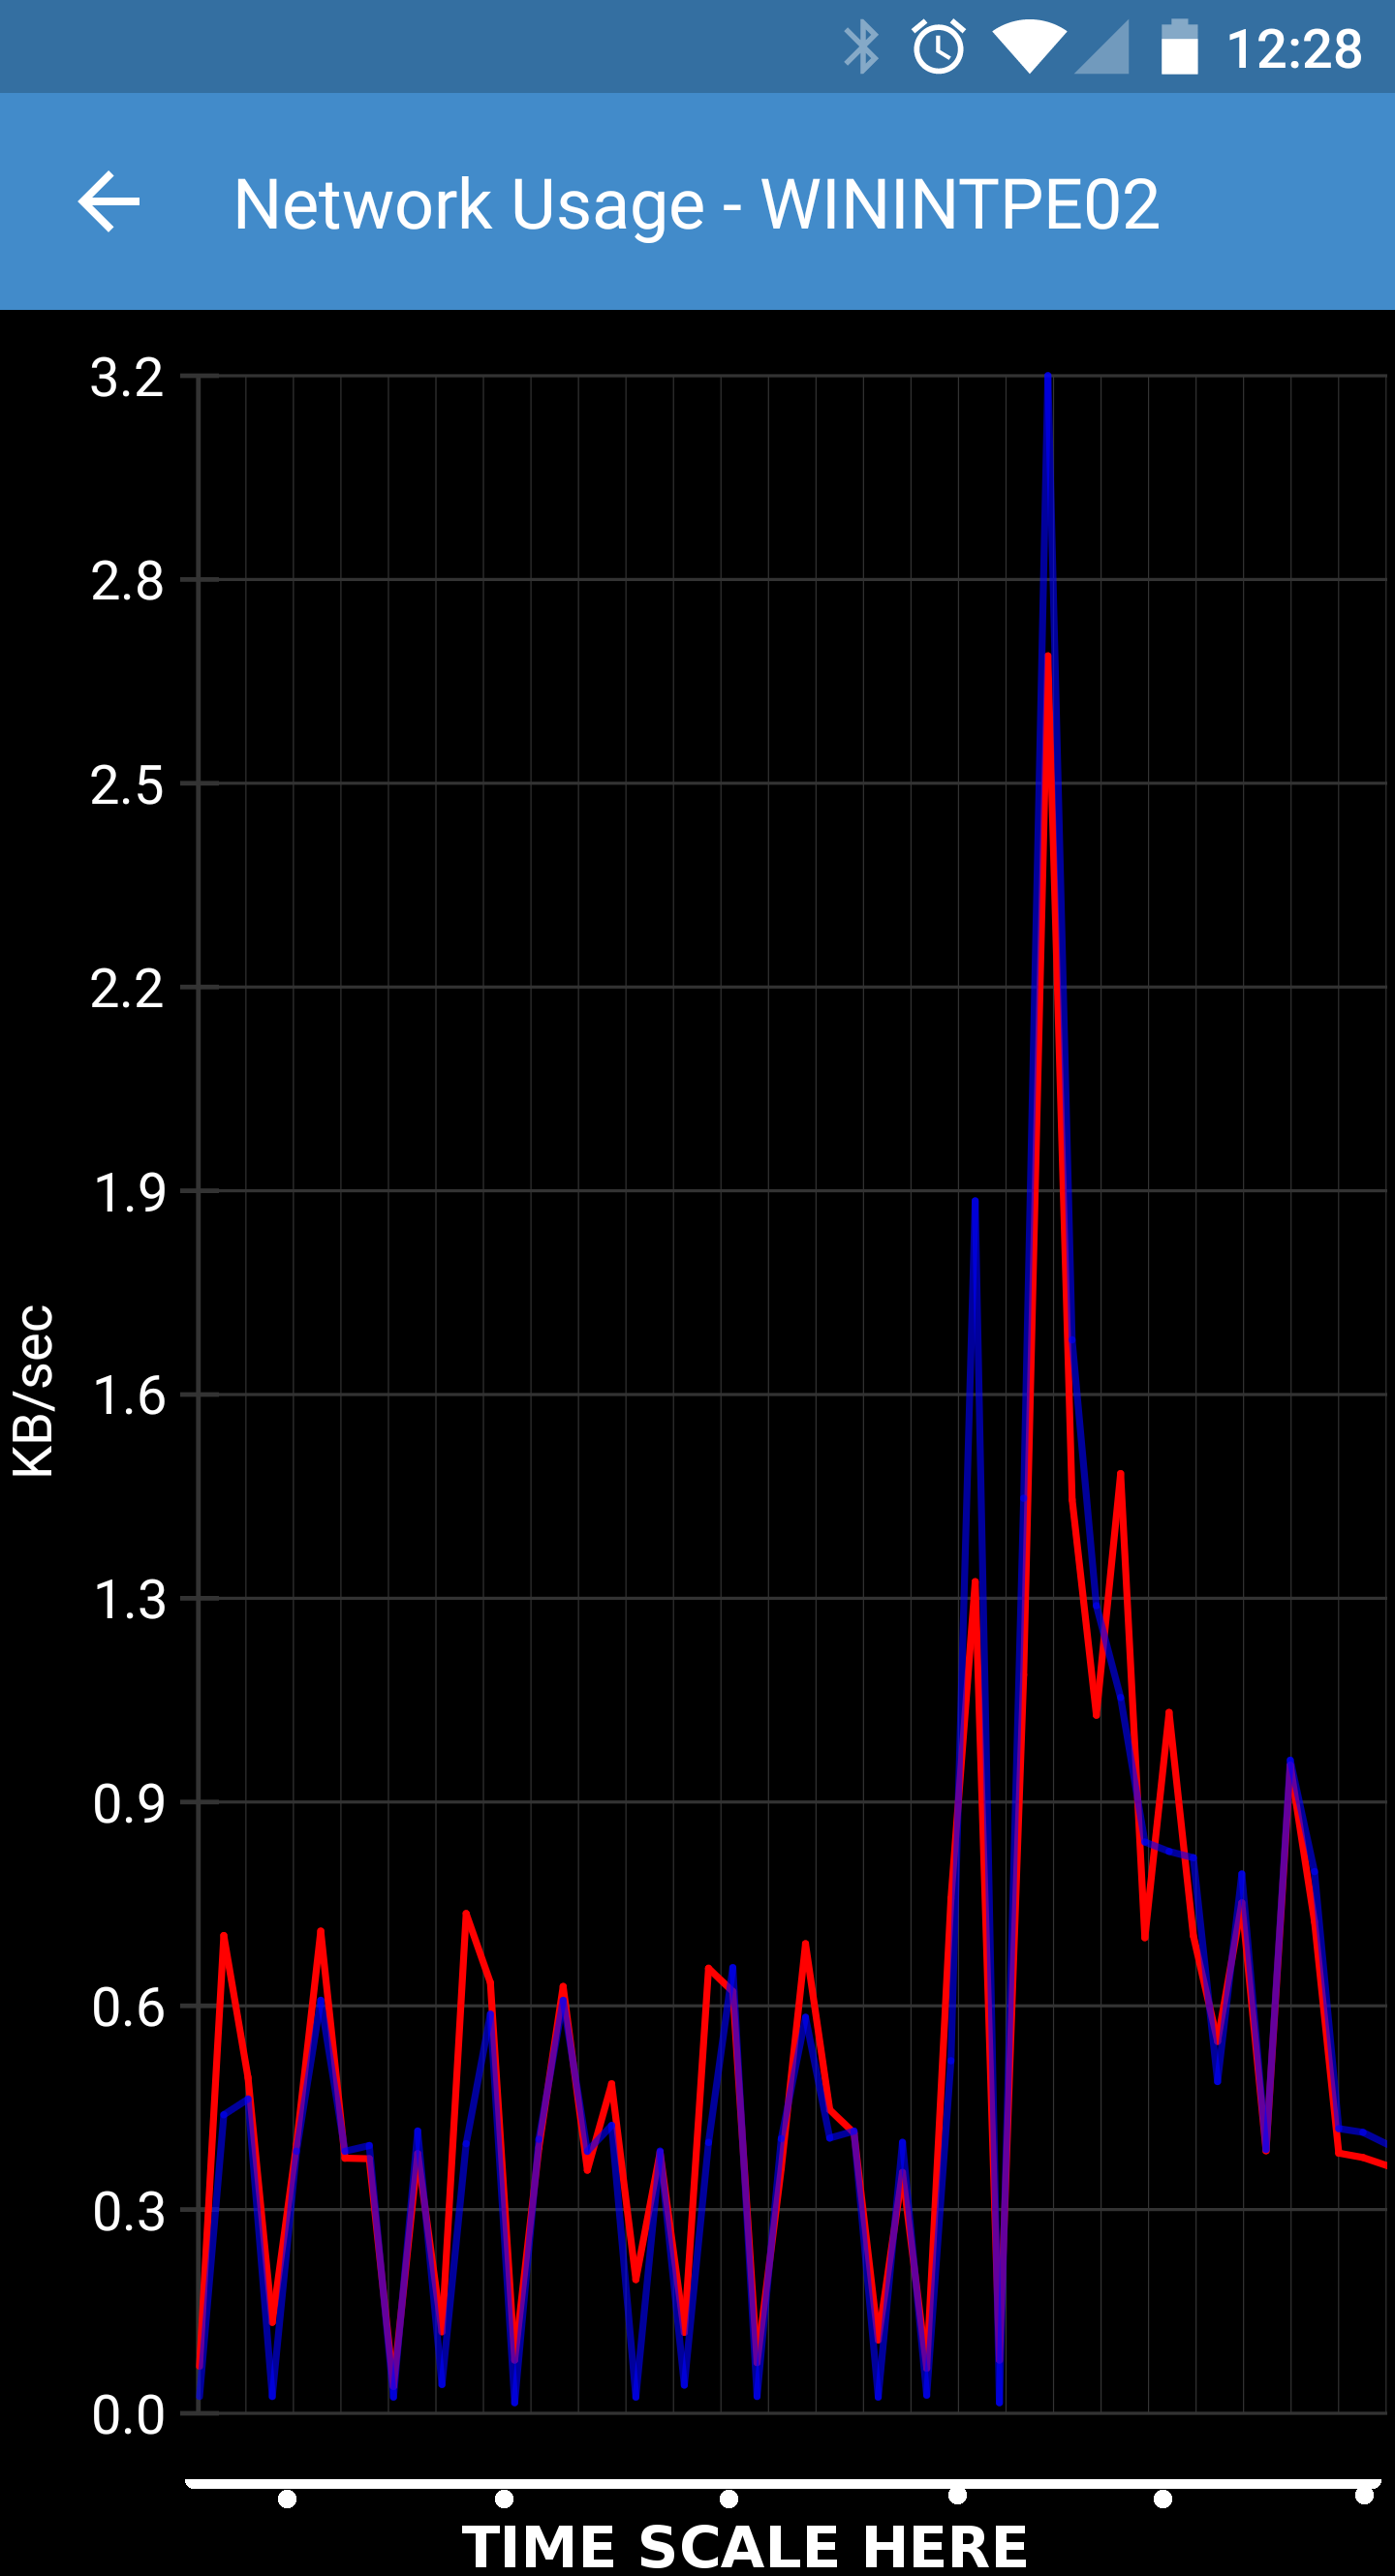
 Please enhance the graphs that are generated in the applications. For instance, the network graph does not even specify the time scale at the bottom (See image attached). It should also have the ability to scale the graph to look at different time ranges. Also it would be nice to be able to see a graph of things like the performance counters. We are loving just about everything about PulseWay at our company, the biggest wish here though is to be able to see historical information over time in graphs for the various monitored metrics. This is a pretty standard feature of every other monitoring product on the market, please bring it to PulseWay! Thanks, Ryan Waldron Senior Systems Engineer Intelity Hospitality Solutions
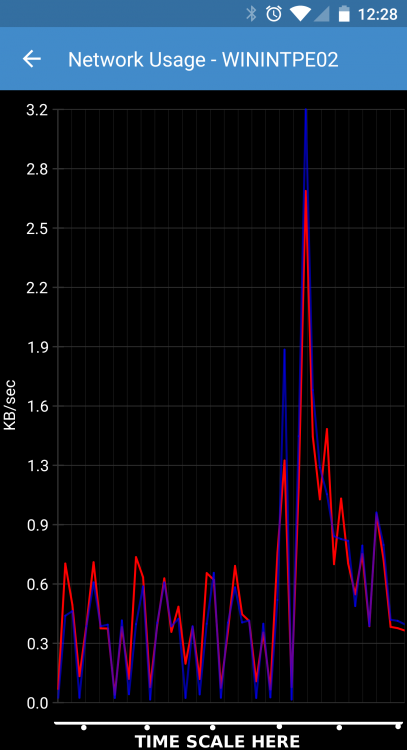
-
 Hi guys I've already contacted Pulseway support about this last year and I was told that they are looking into it. Now I'd like to get a quick update, if it's still being considered, and what other users think. I would like to have a (REST) API where I can get different values (especially the screens) like they are provided via the official apps. And is there any chance we could get a more capable API until summer 2016? (Otherwise I'll have to code it myself. :-D) In my specific case I want to build a web-based dashboard which displays frequently updated screenshots of each system. This would be very useful if you run digital signage computers or similar systems and want to check, if the displayed contents are okay. When digging into the official web-app I saw that Pulseway is already using such an API with AngularJS. Would it be possible to make this API (or parts of it) public? Alternatively displaying the screen contents could also be implemented into the Dashboard app. (It wouldn't quite solve my case but it's something. :-) )