
gbrown481
-
Joined
-
Last visited
Posts posted by gbrown481
-
-
can a feature be added to schedule the reports that are available manually?
so say set up a schedule to email a disk space report every morning?
if this is already a topic, or available id be grateful if someone could point me in the right direction.
thanks in advance.
Gary
-
hi there,
is there any way that the pulseway app can send a notification when a new network device is connected to the network and gather some info on what it is??
then once it has got this info, run a report to show what devices are connected to the network at a given time??
just floating ideas out there
thanks in advance
Gary
-
not bothered about saving the credentials on the server, just the port numbers for different servers.
so say there was somewhere on the enterprise server that you could configure rdp connections for the client rather than on each dashboard?
having the rdp connection option in the dashboard is a big big plus though, so thanks for that!
-
is there any way that the remote desktop connection configs can be done centrally?
so for example we have 4 people using the dashboard on different pcs, can we set up the remote desktop configs on the enterprise server which then creates a config file that can be loaded into the dashboard. otherwise each person needs to amend each server in the dashboard.
Thanks in advance
Gary
-
not sure where to post this question, so gone for general.
is there a way, or should i create a feature request, to create a disk space report (say a graph) to show disk space usage over a period of time, i know i can create a number of notifications, with priority getting higher and higher as the space gets lower and lower to see that the space on a selected disk is getting low, but would be nice to create a graph so we can predict when the disk is due to run out?
thanks in advance
Gary
-
not sure whether anyone uses ubiquiti wireless devices, but we now have a quite a few of them, and theyre managed centrally using a web interface. i was just wondering whether there is something that could be set up to monitor whether they go offline?
i would set up a ping request, but most of the devices are on networks that dont have servers, and only have client laptops installed that dont have the pulseway software installed on, and arent there all the time anyway

-
hi there
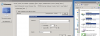
when we try and create a notification for low disk space on a specific server, no disk appear in the drop down box to choose the level of notification
attached image of the drop down box and disks that should show
thanks in advance
Gary
-
i know it shouldnt so im not sure how it is archiving them itself.
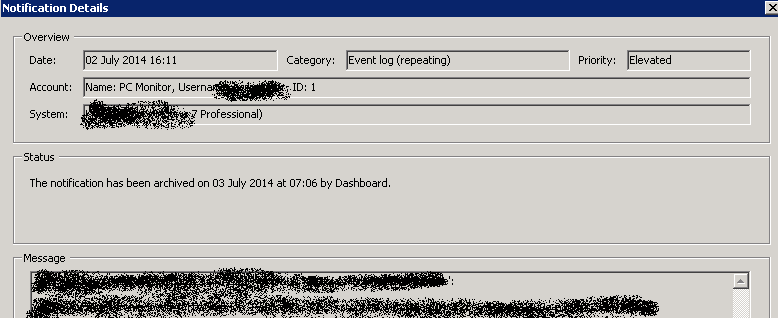
on the dashboard there is no reference to the notifications, but on the enterprise server in notifications, it shows that there are elevated notifications that have been archived by the dashboard as per the image on the first post.
its causing me to miss elevated notifications as they arent showing on the dashboard.
the notification im using as an example was fired up sometime after hours, and by the time i have come into the office in the morning its not there!
-
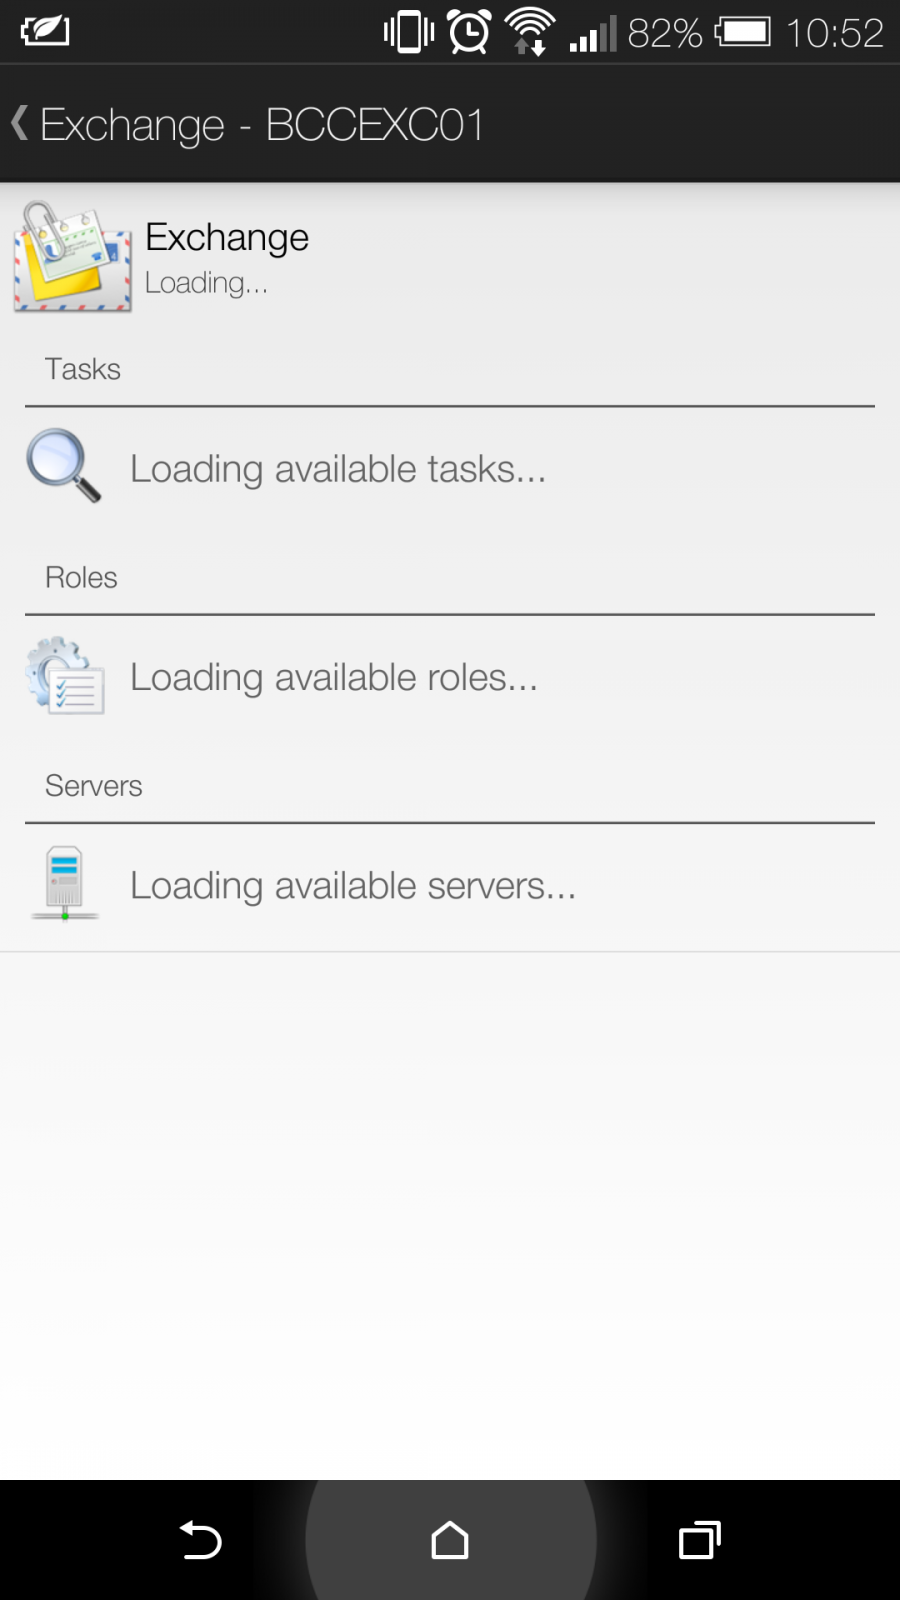
since the latest 4.4 update on windows/android, i have been unable to load anything related to exchange up on any servers with the exchange installed. opening the exchange module on android, web interface or windows 8 app just brings up the "loading available tasks..." below tasks roles and servers, then that page goes and it just shows no data.

-
im not sure whether this is a feature or whether it can be changed.
we had an elevated notification that occurred yesterday night, which has then been archived by Dashboard this morning before we have got in the office. is there a reason for this archive at the specific time it has done it?
the notification in question has had a more recent success but the dashboard has archived it 9 hours or so after?
attached event from admin console
-
i dont see the point of having a monitoring tool that doesnt monitor?
we have set low priority notifications to see for example who is logging in and out of a terminal server and when, so the customer can have a report of how often its being used, these arent critical in a sense of we need to act on them, so they are set to low, but they still need to be kept on the dashboard/back end reports, but i dont necessarily need to see them on my phone, does that make more sense?
-
-
is there a specific setup required for auto update to work? both on the dashboard and windows manager
our products dont update themselves, so i have to manually do them each time you release an update! wouldnt mind if it was only a few, but we have 80 clients!
-
-
is there any way that only critical notifications can be flagged up on an android app rather than all the notifications that come through?
-
hi there
was wondering whether there is a way to change the way that the maintenance schedule works?
basically, its a great idea, and does help, but say we have the maintenance schedule on during the night, but still want to see the notifications during this time at a later time, can this be implemented so that they are stored somewhere?
thanks...gary
-
hi there
i have a couple of requests that im not sure whether they have been asked before, by myself or anyone else.
is there a way that we can prioritize notifications to mobile devices so that only the critical or elevated notifications come through to mobile devices rather than all notifications??
also, is there a way that when a check on disk space is done, the same check can be done after a certain period of time, and if the disk space has changed from the previous notification that the notification can be changed to accommodate the new value?
any updates on future releases or help for the above would be grateful.
thanks in advance.
Gary
-
does anyone know whether the status notifications can be changed to send as elevated rather than just normal?
say if the public ip of a site changes (not ideal for a server, but what can you do while in contract and BT charge you to change to static) pc monitor does send a notification, but its not elevated so i dont see it unless i go into the server on the dashboard, could do with it grabbing my attention as things need to be changed asap.
thanks
gary
-
-
i know this thread is for dashboard on windows
but im not sure where to ask this question
is there a plan to get the dashboard to work on linux? as in beaglebone black or raspberry pi?
-
does anyone know whether there is a way to get offline systems to be flagged as a critical notification
for example in the notifications tab, then status the top tick box is for when a computer is offline, which that shows as red on the dashboard, but we have that many servers with pc monitor installed that we have the dashboard set up to only show critical alerts but it doesnt show the offline systems
-
-
im not sure whether i have asked this question before but anyway
is there any way that a version of pc monitor can be installed on a vmware host so that the hardware can be monitor, like disk space on the datastore and any firmware errors etc?
thanks
-
is there a feature (or could one be created) that creates a report to show the uptime of a server over a period of time??
so just showing times and dates the server went off/on.
there is a performance graph on the web interface, but its not something that can be given to a client as a report.


Dashboard Sound
in Dashboard
Posted
hi there
i seem to have an issue where the dashboard doesnt produce a sound when a new notification is flagged up? it doesnt matter whether i choose a manual sound or the default, it doesnt make a noise. the volume on the screen works, as other apps make sounds.
have you seen this before? or can you help?
thanks